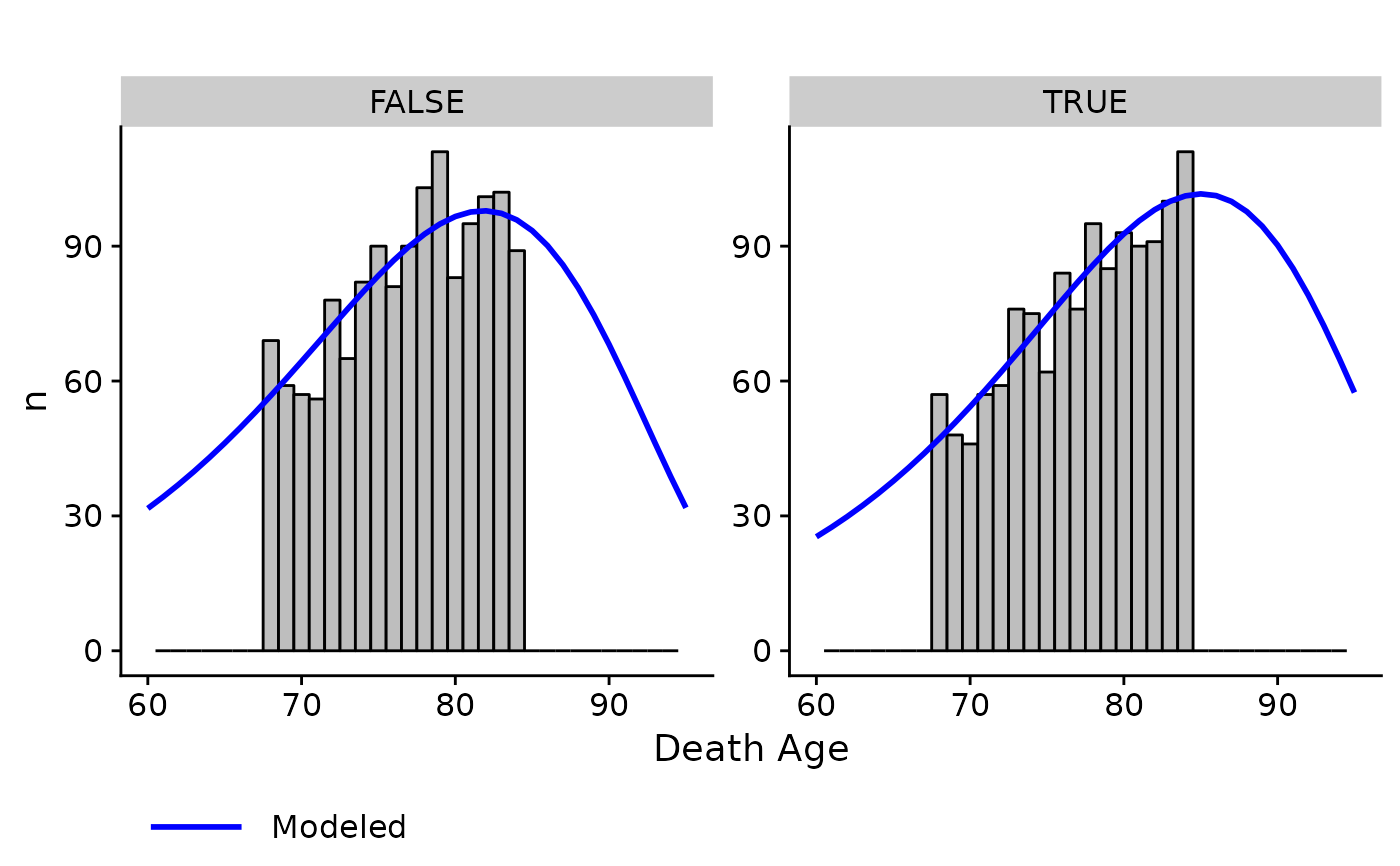
Compare empirical and modeled distribution of ages of death within a cohort. Only works with a single discrete covariate and a single cohort.
Usage
diagnostic_plot(
  data,
  object,
  covar,
  death_var = "death_age",
  byear_var = "byear",
  xlim = c(65, 110)
)
Arguments
- data
data used to create gompertz_mle object
- object
gompertz_mle object
- covar
covariate of interest
- death_var
death age variable
- byear_var
birth year/cohort variable
- xlim
x-limits for figure
Examples
# Create a single-cohort data set
numident_c1920 <- numident_demo %>% dplyr::filter(byear == 1920) %>%
dplyr::mutate(finished_hs = as.factor(educ_yrs >= 12))

# Run gompertz_mle()
gradient <- gompertztrunc::gompertz_mle(formula = death_age ~ finished_hs,
left_trunc = 1988, right_trunc = 2005, data = numident_c1920)

# Create diagnostic histogram plot using model outcome
gompertztrunc::diagnostic_plot(object = gradient, data = numident_c1920,
covar = "finished_hs", xlim = c(60, 95))